
Function or Not? The Vertical Line Test
When is a graph a function? See why functions matter, the vertical line test, and how piecewise functions you learned in high school hint at limits in calculus.

As a little girl, I once turned my grandmother’s chartreuse basement into a makeshift repertory cinema. I put together a concession stand with the room-temperature fruit punch and microwave popcorn in her pantry, lugged every padded dining-room chair downstairs, and even crafted construction-paper tickets for my first screening. My only problem?
Pricing.
Despite efforts to set out how, between my group rate, family pack, and bundle discount, my “unit price” (University of Massachusetts, Amherst, 1998) sagged, the adults in my life had ruled out my two-dollar tickets as highway robbery. I still remember pulling out all the stops to convince them, clattering on and on until I could no longer dredge cannier words, like the teeny tiny salesgirl I was. Rather than trawling for a cannier tongue, though, I should have been trawling for something else—a picture, perhaps—to portray the relationship between the total price and the number of tickets one might buy.
To put it another way, I should have been trawling for a function.
Functions ≠ Graphs
“Functions,” to quote Stewart (2013), “arise whenever one quantity depends on another” (p. 1). In fact, we run every day into such dependencies—some self-evident, others not so much—that inform how one thing depends on another. The purchase frequency of distinct ice cream “sensory profiles” (Motoki et al., 2025) depends on the season. The cost of a taxicab ride depends on the distance one decides to travel. The anxiety levels of college students depend on how many years of schooling they have completed (Conley et al., 2020). There we find, in any case, a dependency whereby for every number—time through seasons t, the distance one travels d, or how many years x—another number can be imputed. Whether the purchase frequency of a particular ice cream P, the cost of a taxicab ride C, or anxiety levels A, that other number P, C, or A depending on t, d, or x makes it a function of t, d, or x.
Not all functions benefit most from graphic representation, however. Stewart (2013), namely, acknowledges four ways to capture a function, each drawing attention to a unique dimension of the same relationship. Revisiting the makeshift cinema in my grandmother’s basement, case in point, my little self might have persuaded the adults in my life:
Visually, without question, by sketching a graph, such as the one here below, that reveals a decrease in the average unit price as the number of tickets augments; and
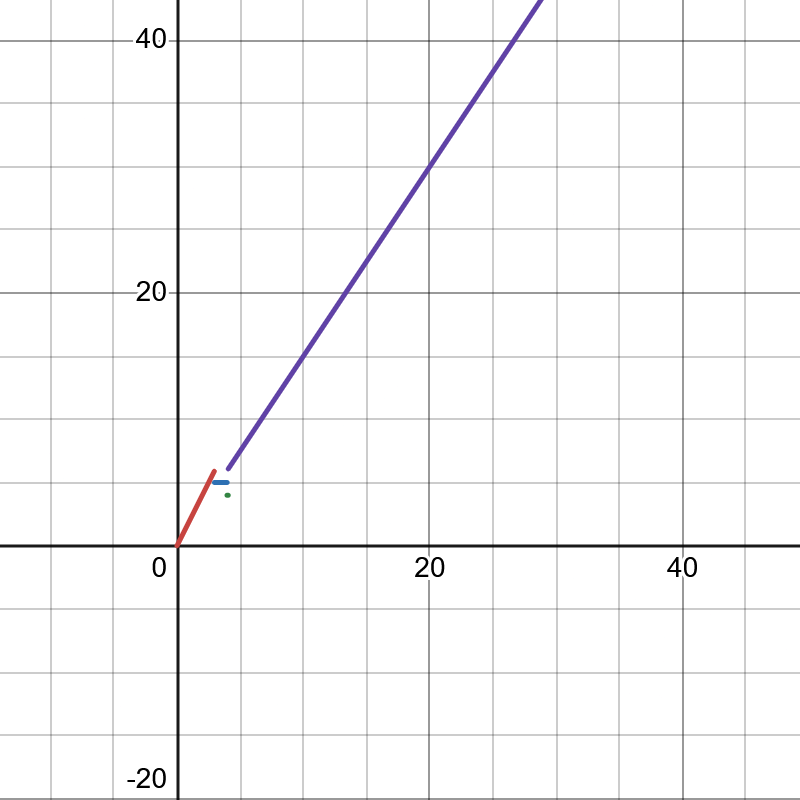
Verbally, like I did, by explaining that, although one ticket cost $2, the bundle discount made three tickets $5; the family pack, four tickets $4; and the group rate, one ticket $1.50 if more than four were purchased; but also
Numerically by building a table, such as the one here below, that imparts the number of tickets alongside the total price, showing how the average unit price changes as more tickets are bought; and
Algebraically, the aforementioned graph and table following the expression here below:
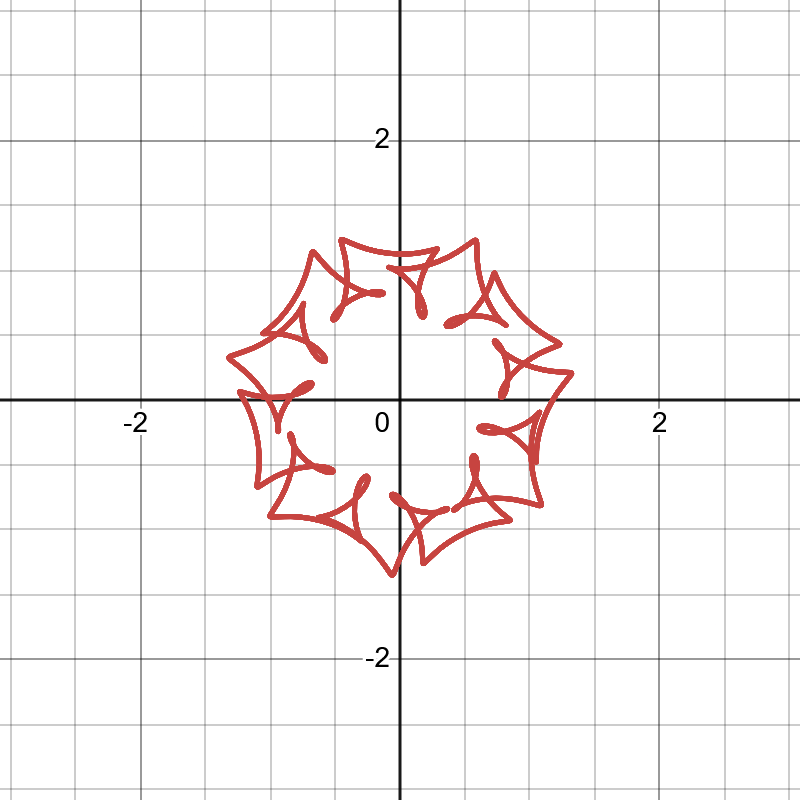
But why is this any more a function than this random curve1?
The Vertical Line Test
If each vertical line x = a intersects a curve only once, at (a, b), then exactly one functional value is defined by f(a) = b. But if a line x = a intersects the curve twice, at (a, b) and (a, c), the curve can’t represent a function because a function can’t assign two different values to a. (Stewart, 2013, p. 5)
And so, why can Figure 1 be a function, whereas Figure 2 is not? Because, no matter the number of tickets one grabs, for every input in Figure 1, there exists only one possible price. Conversely, for every input in Figure 2, there may be more than one possible output for a price. That conclusion is borne out of the observation that, if one draws a vertical line across the curve, the line will touch the curve more than once—our vertical line test!
Summary


At n = 1, n = 5, and n = 10 in Figure 1, the orange vertical line touches the curve only once, ∴ Figure 1 → Function.
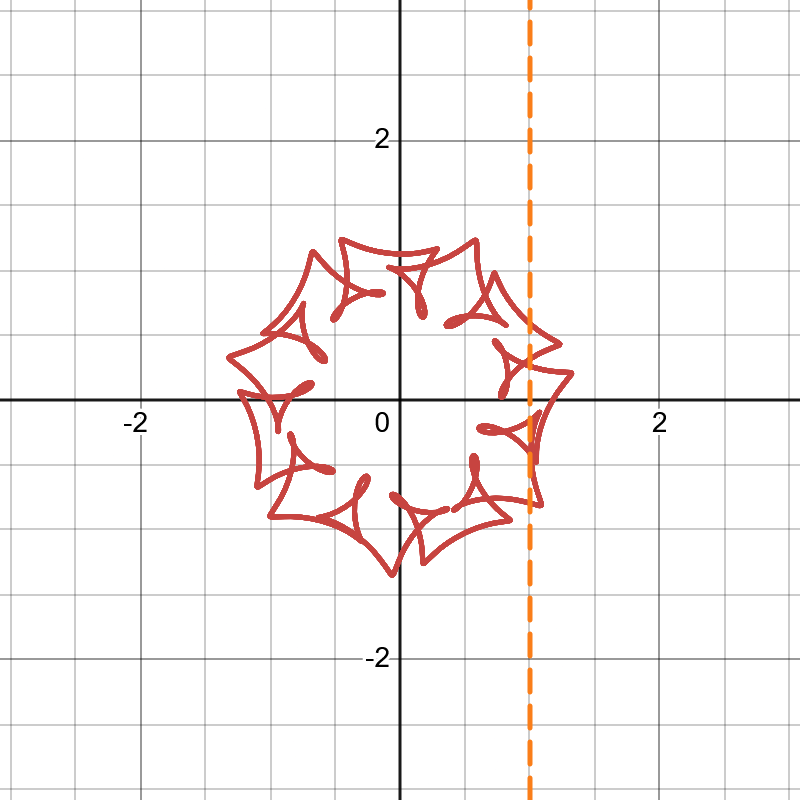
At n = 1 in Figure 2, though, the orange vertical line touches the curve more than once, ∴ Figure 2 → NOT Function.
References
Conley, C. S., Shapiro, J. B., Huguenel, B. M., & Kirsch, A. C. (2020). Navigating the college years: Developmental trajectories and gender differences in psychological functioning, cognitive-affective strategies, and social well-being. Emerging Adulthood, 8(2), 103–117. https://doi.org/10.1177/2167696818791603
Motoki, K., Kuroda, R., Sugai, E., Miura, A., Ichimasa, Y., & Yagi, Y. (2025) Seasonal changes influence preferences for the sensory profiles of ice cream. Food Quality and Preferences, 134. https://doi.org/10.1016/j.foodqual.2025.105658
Stewart, J. (2013). Single variable essential calculus: Early transcendentals (2nd ed.). Cengage Learning.
University of Massachusetts, Amherst. (1998, March 31). Unit price. Nutrition Information Bulletin Board and Learning Experience for Adult Basic Education. https://umass.edu/nibble/infofile/unitpric.html
This “random curve” is not so much a “random curve” as
if still not a function as we understand later in the article.
Love the graphics :) !
Thank you for this thorough, well cited breakdown.